
FINANCIAL CONTROL & PERFORMANCE | LUXEMBOURG
Do your financial figures really explain what is driving performance?
Financial Control & Performance | Insight & Decision Support
Financial reporting should do more than describe past results. It should help management understand where performance is created, where margins are under pressure and which operational drivers require attention. RedWatch helps turn financial data into clear management insight, relevant KPIs and practical decision support.

WHAT THE NUMBERS SHOULD TELL YOU
Good financial information should help you understand where performance is created and where it is being lost.
Management reporting is most useful when it goes beyond describing results and helps explain the business behind the numbers. The objective is to identify the activities, clients, products or cost drivers that are contributing to performance and those that require attention.

Where is performance really generated?
Which activities, clients or products generate the strongest contribution and margins?
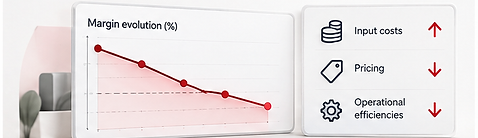
Where are margins under pressure?
Are pricing, costs or operational inefficiencies putting margins under pressure?

Are costs evolving as expected?
Which costs are increasing, and are they aligned with activity levels and business priorities?
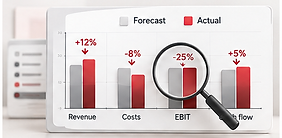
What is driving the variance?
Where are the main gaps between forecast and actuals, and what is driving them?
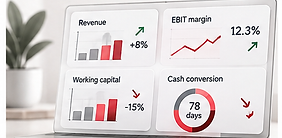
Are you tracking the right KPIs?
Are we tracking the indicators that best explain performance and support decisions?
FROM FINANCIAL DATA TO MANAGEMENT INSIGHT
Financial data creates value only when it helps explain performance and support decisions.
Accounting figures are essential, but on their own they rarely provide enough perspective for management. The objective is to structure the data, identify the key drivers, explain the variances and translate the findings into practical decisions.
01
02
03
04
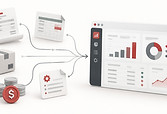



Structure the data
Bring financial and operational information into a clear and consistent view.
Identify the drivers
Highlight the products, customers, activities or cost areas that drive performance.
Explain the variances
Understand the gaps between actual results, budget, forecast or prior periods.
Turn insight into action
Use the analysis to support priorities, corrective actions and management
decisions.
The goal is not more reporting — it is clearer management insight.
UNDERSTANDING THE DRIVERS OF PERFORMANCE
Performance is shaped by several interconnected drivers.
Revenue growth alone does not explain performance. Pricing, margins, cost structure and operational efficiency interact continuously. Understanding these relationships helps management identify where value is created, where it is diluted and where action will have the greatest impact.
Revenue & business mix
Understand how products, customers, activities or markets contribute differently to revenue and profitability.
Pricing & margins
Assess whether pricing reflects the underlying cost structure and whether margins remain aligned with expectations.

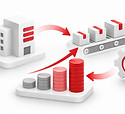
PERFORMANCE


Cost structure
Identify which costs are fixed, variable or increasing faster than activity — and where efficiency can be improved.
Operational efficiency
Connect financial results with operational drivers such as volumes, productivity, utilisation or process performance.
Better insight into the drivers helps focus action where it matters most.
MONITORING PERFORMANCE
The right KPIs should highlight what is changing and where management needs to act.
A useful dashboard does not need dozens of indicators. It should focus on the measures that best explain performance, highlight deviations early and provide management with a clear view of where attention is required.

Revenue growth
Track performance against budget, forecast and prior periods.
Margins
Monitor whether pricing, mix or costs are strengthening or diluting profitability.
Cost evolution
Identify where costs are increasing faster than activity or expectations.
Forecast vs actuals
Highlight material variances and understand what is driving them.
A good dashboard should focus attention, not create noise.